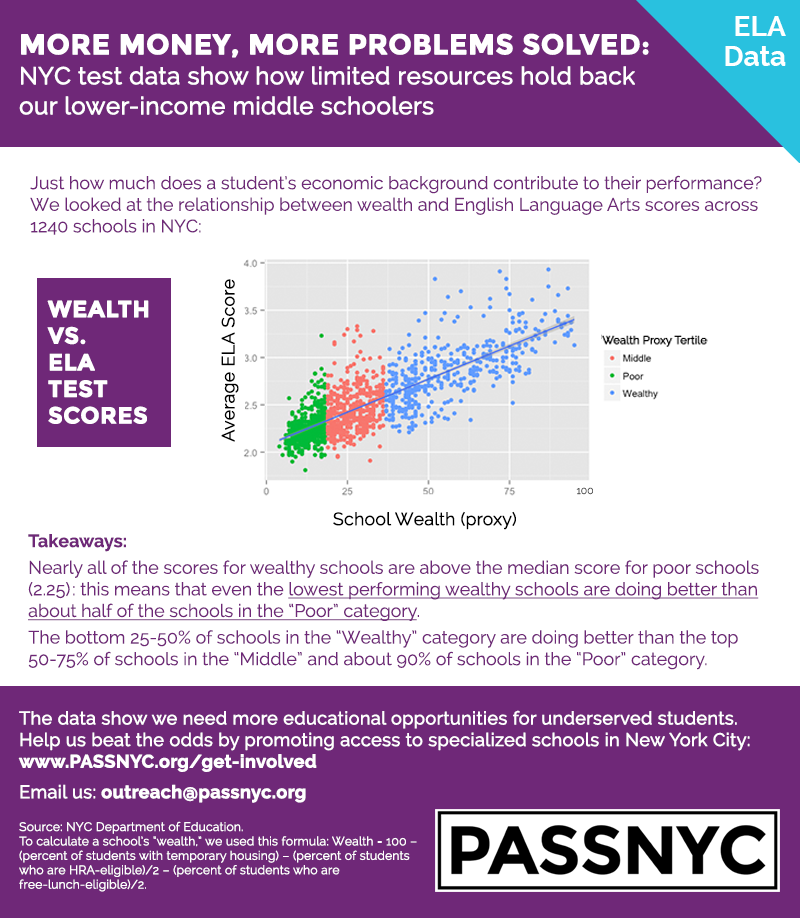
[Infographic] More Money, More Problems Solved: ELA Data
/Just a few days ago, The New York Times published a report showing that sixth graders in the richest school districts across the United States are four grade levels ahead of children in the poorest districts.
Our research team dug into the data in New York City, mapping average ELA and Math scores against school "wealth" indicators. Just how much does a New York City student's economic background contribute to their performance?


